How to Read a Company's Financial Statements Before Investing (2026 Beginner's Guide)
Learn how to read a company's financial statements before investing. Understand the income statement, balance sheet, cash flow statement, and key financial ratios in this complete beginner-friendly 2026 guide.
FINANCE
CryptoFinora Team
7/14/20266 min read
How to Read a Company's Financial Statements Before Investing (2026 Guide)
Focus Keyword: How to Read Financial Statements
SEO Title: How to Read a Company's Financial Statements Before Investing (2026 Beginner's Guide)
Slug: /how-to-read-financial-statements-before-investing
Meta Description: Learn how to read a company's financial statements before investing. Understand the income statement, balance sheet, cash flow statement, and key financial ratios in this complete beginner-friendly 2026 guide.
How to Read a Company's Financial Statements Before Investing (2026 Guide)
Many beginners buy stocks simply because they hear recommendations from friends, social media influencers, or financial news. Unfortunately, investing without understanding a company's financial health can lead to poor decisions and unnecessary losses.
Financial statements provide the real story behind every business. They reveal whether a company is making profits, managing debt responsibly, generating cash, and growing over time. Learning to read these reports is one of the most valuable investing skills you can develop.
Whether you're investing in US stocks, UK companies, or international businesses, understanding financial statements helps you separate strong companies from risky ones.
Why Financial Statements Matter
Before buying shares in any company, investors should know:
Is the business profitable?
Is revenue growing consistently?
Can the company pay its debts?
Does it generate healthy cash flow?
Is management using shareholder money wisely?
Instead of relying on hype, financial statements provide factual answers supported by numbers.
The Three Main Financial Statements
Every public company publishes three essential financial reports.
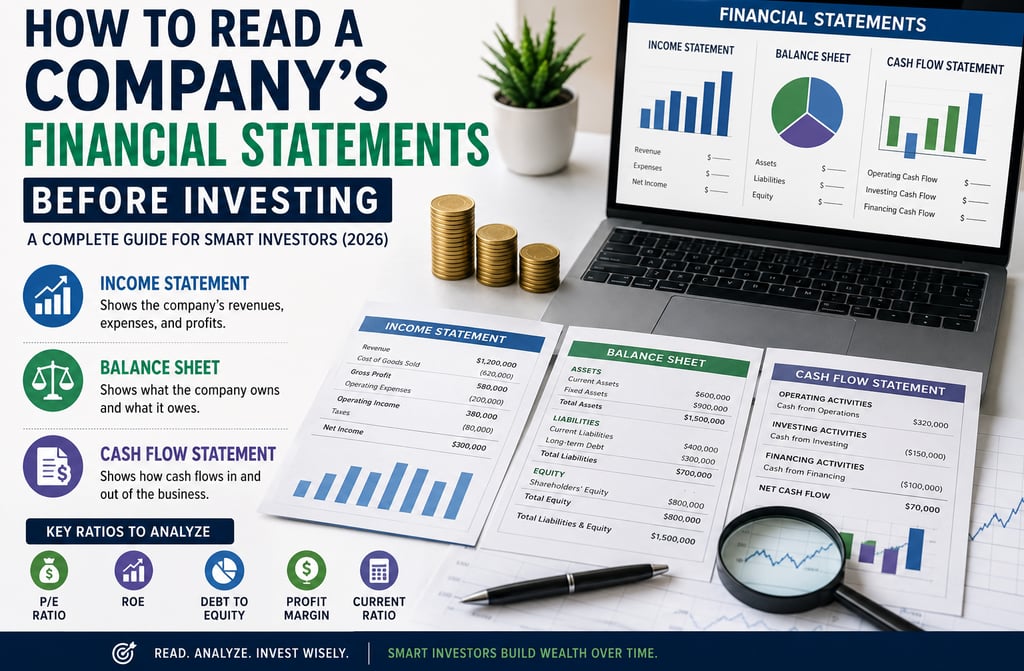
1. Income Statement
The income statement shows how much money a company earns and spends during a specific period.
It includes:
Revenue (Sales)
Cost of Goods Sold (COGS)
Gross Profit
Operating Expenses
Operating Income
Taxes
Net Income (Profit)
What Investors Should Look For
A healthy company generally shows:
Increasing revenue every year
Stable or growing profit margins
Consistent net income
Controlled operating expenses
If sales continue rising while profits fall, it may indicate increasing costs or poor management.
2. Balance Sheet
The balance sheet shows what a company owns and what it owes.
It contains three major sections:
Assets
Assets include everything the company owns.
Examples:
Cash
Buildings
Equipment
Inventory
Investments
Liabilities
These represent debts and obligations.
Examples:
Loans
Accounts payable
Bonds
Taxes payable
Shareholders' Equity
This represents the owners' share after subtracting liabilities from assets.
Formula:
Assets = Liabilities + Shareholders' Equity
A company with growing equity usually indicates long-term financial strength.
3. Cash Flow Statement
Many profitable companies still fail because they run out of cash.
The cash flow statement tracks actual money moving in and out of the business.
It contains:
Operating Cash Flow
Cash generated from daily business activities.
Positive operating cash flow is generally a strong sign.
Investing Cash Flow
Money spent on:
Equipment
Acquisitions
Investments
Negative investing cash flow isn't always bad if the company is expanding.
Financing Cash Flow
Money related to:
Debt
Dividends
Share buybacks
New stock issuance
Understanding these sections helps investors know how a company funds its operations.
The Relationship Between the Three Statements
The three reports work together.
For example:
Revenue appears on the Income Statement.
Net Income flows into the Cash Flow Statement.
Cash affects the Balance Sheet.
Professional investors never analyze only one statement—they study all three together.
Look for Growth Trends, Not One Good Year
One strong year doesn't necessarily mean a company is an excellent investment.
Instead, compare financial results over:
3 Years
5 Years
10 Years
Consistent growth is usually a stronger indicator than sudden spikes.
1. Earnings Per Share (EPS)
Formula:
EPS = Net Income ÷ Outstanding Shares
EPS shows how much profit a company earns for each share of stock.
Why It Matters
A steadily increasing EPS often indicates that a company is becoming more profitable and creating greater value for shareholders.
Example:
Company A EPS (2024): $2.40
Company A EPS (2025): $3.10
Company A EPS (2026): $3.95
This upward trend is generally a positive sign.
2. Price-to-Earnings (P/E) Ratio
Formula:
P/E Ratio = Share Price ÷ EPS
The P/E ratio tells investors how much they are paying for each dollar of a company's earnings.
General Interpretation
Low P/E: May indicate an undervalued stock or slower growth.
Moderate P/E: Often reflects fair valuation.
High P/E: May suggest strong future growth expectations, but it can also indicate overvaluation.
Always compare a company's P/E ratio with competitors in the same industry rather than across different sectors.
3. Debt-to-Equity (D/E) Ratio
Formula:
Total Debt ÷ Shareholders' Equity
This ratio measures how much debt a company uses compared to its own capital.
What Investors Prefer
A lower debt-to-equity ratio is generally considered healthier because it means the company relies less on borrowed money.
Very high debt can become a problem if interest rates rise or business conditions weaken.
4. Return on Equity (ROE)
Formula:
Net Income ÷ Shareholders' Equity
ROE measures how efficiently a company uses shareholders' money to generate profits.
Why It's Important
Companies with consistently strong ROE often have effective management and efficient operations.
Rather than looking at a single year's ROE, compare it over several years to identify consistent performance.
5. Current Ratio
Formula:
Current Assets ÷ Current Liabilities
This ratio measures a company's ability to pay its short-term obligations.
Basic Guidelines
Above 1.0: Generally indicates the company can cover its short-term debts.
Well below 1.0: May signal liquidity concerns.
The ideal range varies by industry, so compare similar companies.
6. Profit Margin
Profit margin shows how much profit a company keeps from every dollar of revenue.
Formula
Net Income ÷ Revenue × 100
Example
Revenue: $100 million
Net Income: $15 million
Profit Margin: 15%
Higher and stable profit margins usually indicate better cost control and operational efficiency.
7. Free Cash Flow (FCF)
Free Cash Flow is the cash remaining after a company pays for operating expenses and capital investments.
Strong free cash flow allows a company to:
Pay dividends
Buy back shares
Reduce debt
Invest in future growth
Handle economic downturns
Many experienced investors consider free cash flow one of the most important indicators of financial strength.
Compare Companies Within the Same Industry
Financial ratios are most useful when comparing businesses in the same sector.
For example:
Compare banks with other banks.
Compare technology companies with other technology companies.
Compare retailers with other retailers.
Industry differences can make ratios look very different even when companies are healthy.
Watch Long-Term Trends
Avoid making investment decisions based on one year's data alone.
Instead, review:
Revenue growth over the last 5 years
EPS trend
Debt levels
Profit margins
Cash flow consistency
Companies with stable, long-term improvement are often better candidates for long-term investing than those with short-lived spikes.
Common Red Flags to Watch For
Before investing, check whether any of these warning signs appear consistently.
1. Declining Revenue
If a company's revenue has been falling for several years, it may indicate declining demand, stronger competition, or operational challenges.
A single weak year isn't always a problem, but a long-term downward trend deserves careful attention.
2. Rising Debt
Some debt is normal for growing businesses. However, rapidly increasing debt without corresponding growth in revenue or profits can create financial pressure.
Always compare debt levels over multiple years instead of focusing on one report.
3. Negative Cash Flow
A company may report accounting profits while still losing cash.
If operating cash flow remains negative year after year, the business may struggle to fund daily operations without borrowing additional money.
4. Falling Profit Margins
When revenue continues to grow but profit margins shrink, it often means expenses are rising faster than sales.
Lower margins can reduce future earnings and limit business growth.
5. Frequent Share Dilution
Some companies issue new shares regularly to raise money.
While this can help fund expansion, excessive dilution reduces each existing shareholder's ownership percentage and earnings per share.
6. Inconsistent Earnings
Large swings in profits every year may suggest an unstable business model.
Many long-term investors prefer companies with predictable and steadily growing earnings.
Where to Find Official Financial Statements
Always rely on official sources instead of social media posts or rumors.
Useful sources include:
Company Investor Relations websites
Annual Reports (10-K)
Quarterly Reports (10-Q)
Official stock exchange filings
Trusted financial platforms such as Yahoo Finance, Google Finance, and MarketWatch
Using official reports helps ensure you're making decisions based on accurate information.
A Simple Financial Statement Checklist
Before buying any stock, ask yourself these questions:
✅ Is revenue increasing consistently?
✅ Is net income growing over time?
✅ Does the company generate positive operating cash flow?
✅ Is debt under control?
✅ Is Earnings Per Share (EPS) improving?
✅ Are profit margins stable or increasing?
✅ Is Return on Equity (ROE) healthy?
✅ Does the company have a competitive advantage in its industry?
If you answer "Yes" to most of these questions, the company may deserve further research.
Mistakes Beginners Should Avoid
Many new investors make avoidable mistakes, including:
Buying stocks based only on social media trends.
Ignoring debt levels.
Looking only at the share price.
Focusing on one quarter instead of long-term performance.
Investing without understanding the business model.
Skipping the cash flow statement.
Successful investing is built on patience, research, and disciplined decision-making.
Final Thoughts
Learning how to read financial statements is one of the most valuable skills any investor can develop. By understanding the Income Statement, Balance Sheet, and Cash Flow Statement, you gain a clearer picture of a company's financial health beyond market hype.
Rather than chasing short-term trends, focus on businesses with consistent revenue growth, healthy cash flow, manageable debt, and strong profitability. Over time, this disciplined approach can help you make more informed investment decisions and build a stronger long-term portfolio.
Remember, every great investor started by learning the basics. The more financial reports you read, the easier it becomes to recognize high-quality companies and avoid unnecessary risks.
Frequently Asked Questions (FAQs)
1. Which financial statement is the most important?
There isn't a single most important statement. Investors should analyze the Income Statement, Balance Sheet, and Cash Flow Statement together for a complete picture.
2. What is a good P/E ratio?
A good P/E ratio depends on the industry. Compare a company's P/E with similar businesses rather than using a fixed number.
3. Why is cash flow important?
Cash flow shows whether a company generates enough cash to operate, invest, pay dividends, and reduce debt.
4. How often should I review financial statements?
Long-term investors typically review quarterly reports and annual reports to monitor company performance.
5. Can beginners learn financial statement analysis?
Yes. With regular practice and by understanding a few key metrics, beginners can confidently analyze companies before investing.
CryptoFinora
Your trusted source for crypto news, blockchain guides, Bitcoin analysis, and personal finance insight.
COMMUNICATION
muneebrehman2224@gmail.com
© 2026 CryptoFinora. All Rights Reserved - Trusted Crypto & Finance Insights.